If you run a business and want to understand your local market, GrowthIM gives you a full report in minutes. This guide walks you through the whole thing, from creating your account to reading every section of your report. No technical knowledge needed.
Here is exactly how it works.
Step 1: Sign Up
Head to growthim.com and create your account. All you need is your email to get started. Signing up takes less than a minute.
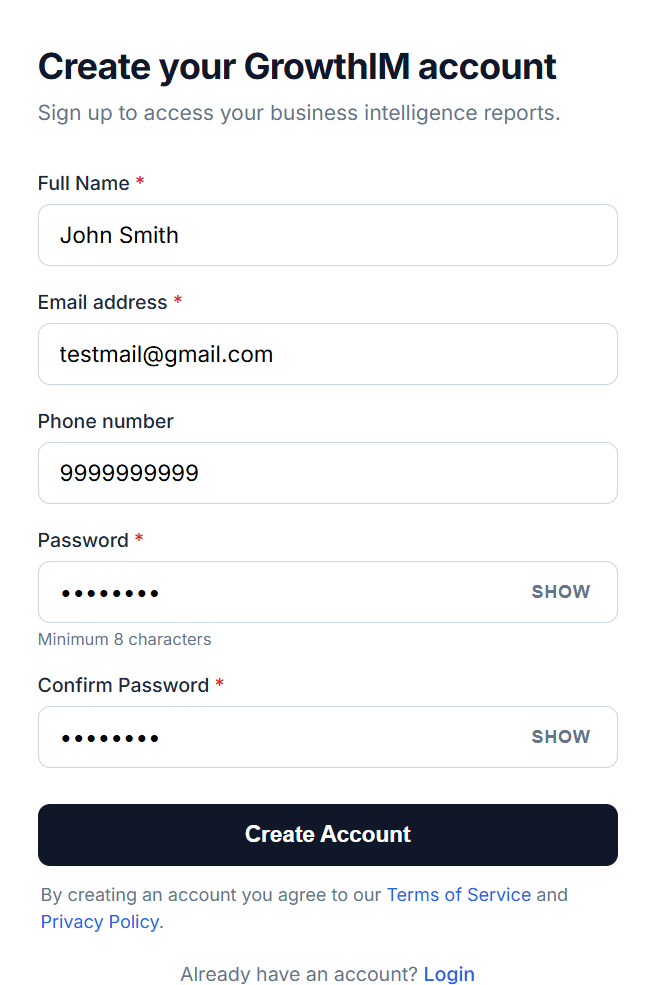
Once you enter your details, you are ready to verify your email.
Step 2: Verify Your Email
After you sign up, GrowthIM sends a verification code to your email. Open your inbox, find the email, and enter the code to confirm your account. This keeps your account secure and makes sure your reports reach you.
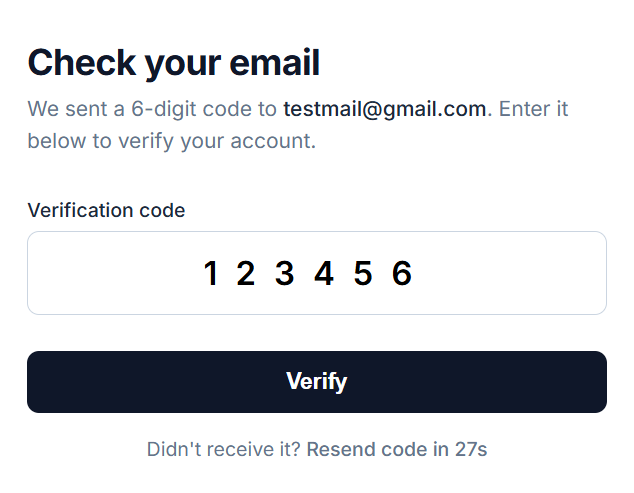
Once verified, you land in your account.
Step 3: Your Dashboard
After you verify, you arrive at your dashboard. This is your home base, where all your reports will live. The first time, it is empty, so there is just one button to look for: New Report. Click it to start your first analysis.

Step 4: Enter Your Business
Now tell GrowthIM which business you want a report on. Start typing your business name and it automatically finds your business and pulls in its details, so you do not have to type anything manually. Just select your business when it appears in the list.
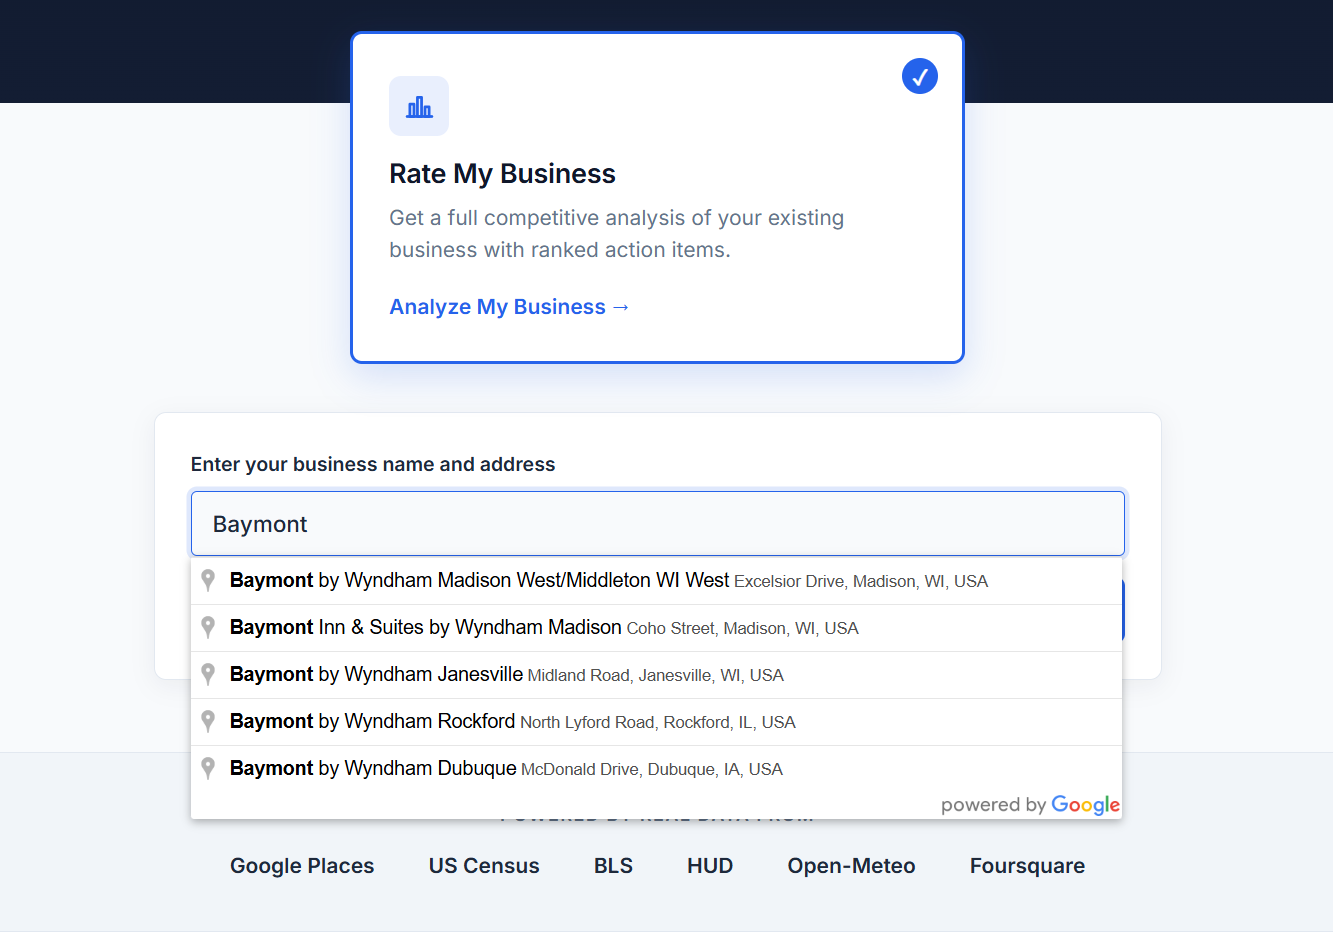
Once you confirm your business, you move on to checkout.
Step 5: Checkout
A GrowthIM report is a one-time $29.99, with no subscription and no recurring charges. Enter your details on the secure checkout to complete your purchase.
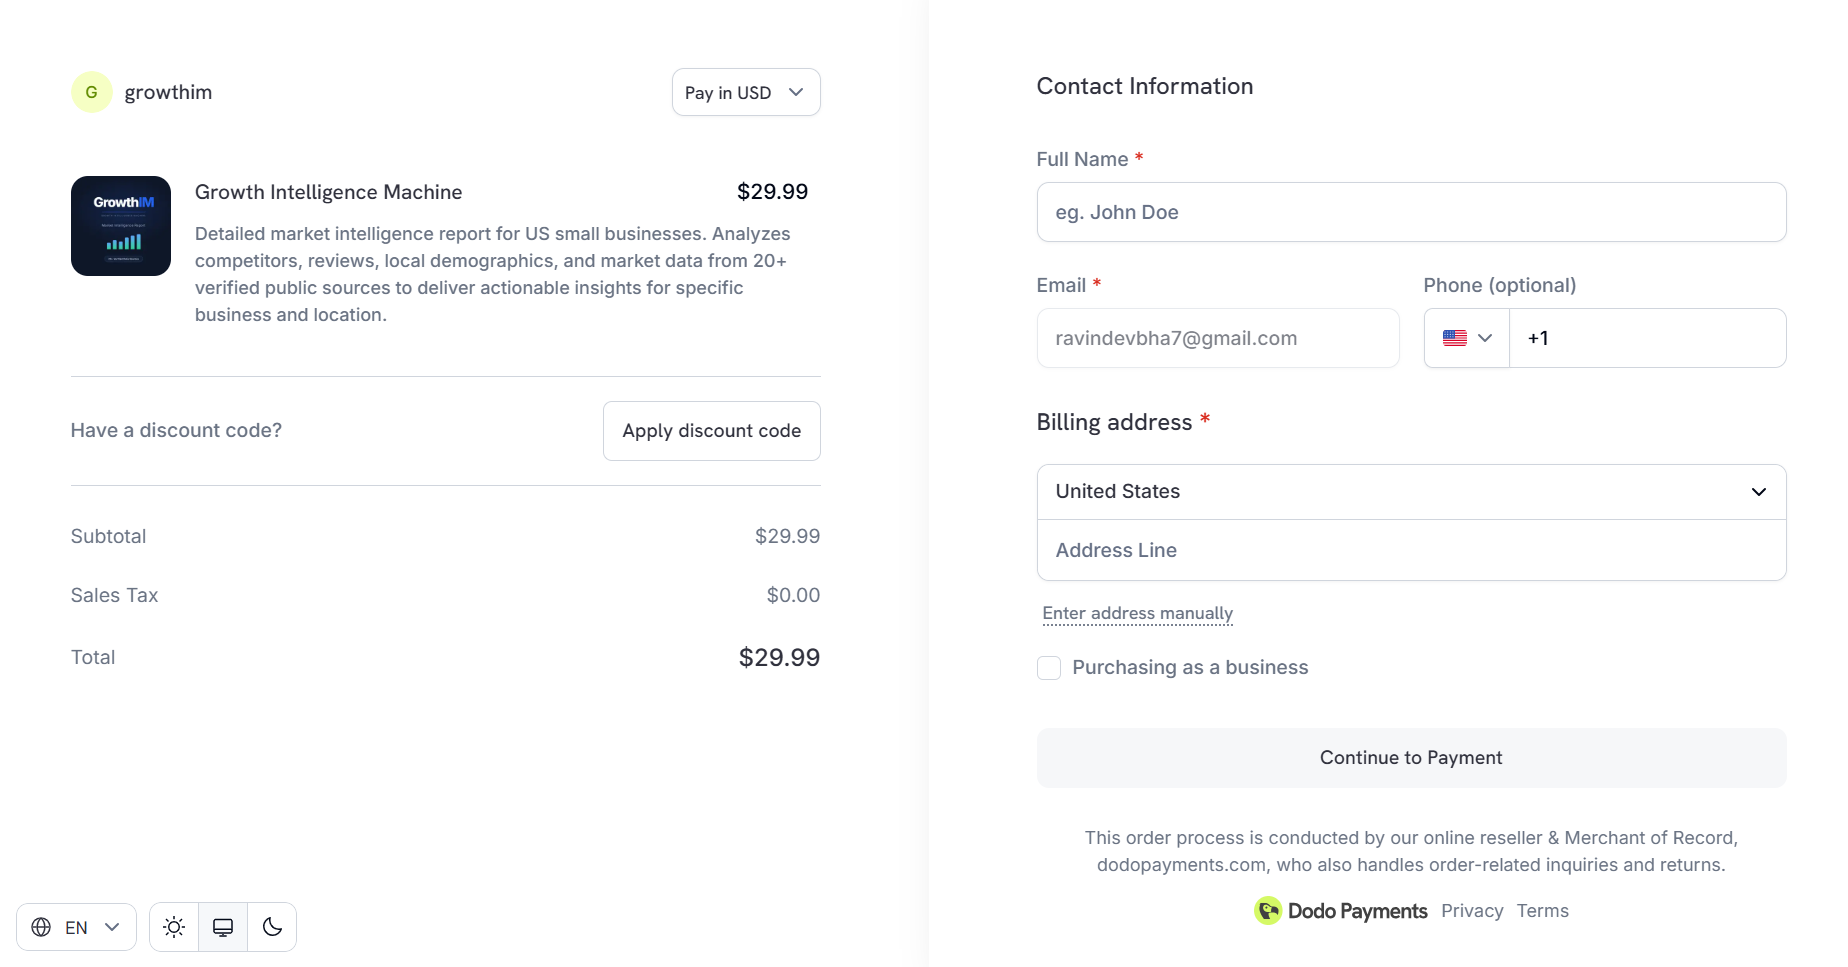
After payment, GrowthIM goes to work. It pulls from 27 APIs and databases to analyze your entire local market. Your report is typically ready in about 15 to 30 minutes. You can keep the tab open or close it and come back later, since your report will be waiting for you in your dashboard.
When it is ready, open it from your dashboard. Now comes the best part: reading what GrowthIM found about your market.
What Is Inside the Report
Your report is around 50 pages, built entirely from real data. Every number is sourced. Nothing is made up. Here is every section you get and what each one tells you.
15 Opportunities Nobody Nearby Is Doing
This is one of the most valuable sections. GrowthIM finds 15 specific opportunities in your market that nobody nearby is taking advantage of yet. These are real gaps, things your competitors are not doing, that you could move on first. Each opportunity is explained with why it works in your specific area.
10 Priority Actions
Ten concrete actions, ranked by priority, that you can take to improve your position in your market. These are not vague tips. Each one is specific to your business and your local data, with the reasoning behind why it matters and how to act on it.
A Full 90 Day Action Plan
A complete plan for your next 90 days, built from your market's actual data. It breaks down what to focus on week by week, so you always know your next move instead of guessing. It even includes ready to use templates to help you execute.
Deep Dive On Every Competitor Near You
A full breakdown of every competitor in your area. You see how they show up, where they are strong, where they are weak, and exactly where the gaps are between them and you. This is the kind of competitive picture most owners never get to see.
Key Risks
The main risks facing your business in your market, each explained with a clear mitigation. Knowing your risks ahead of time lets you prepare instead of reacting after the fact.
Market Overview
A clear snapshot of your overall market, setting the context for everything else in the report. This is your starting point for understanding where you stand.
Your Strengths
What your business already does well, based on the data. This section highlights the advantages you can lean into.
Google Ranking Position
Where your business stands in local search, with a full ranking picture and an explanation of what drives it. Search visibility is often the difference between getting found and getting missed.
Review Gap Analysis
A comparison of your reviews against your competitors, showing where you stand and a realistic target to aim for. Reviews shape how customers choose, so this gap matters.
Hours Comparison
A side by side look at your operating hours versus your competitors across the week. Sometimes the simplest scheduling change can capture demand others are missing.
Area Map
A visual map of where your competitors are located in relation to you, so you can see the competitive landscape at a glance.
Location and Market
Your competitive context combined with local demographics, giving you a grounded view of the market you actually operate in.
Anchor Score
A look at the foot traffic and walk up potential around your location, helping you understand your area's natural advantages.
Seasonal Calendar
A season by season view of demand in your market, including how to handle the off season. Knowing when demand rises and falls lets you plan ahead.
Operations and Brand
An assessment of your operational signals and how your brand is positioned in the market.
Market Charts
Clear visual charts that bring your market data to life, including competitive positioning and seasonal demand, plus a lot more you have never seen laid out this way.
That Is It
In about 15 to 30 minutes, you go from typing your business name to holding a full picture of your market that would normally take weeks to put together. Every section is built from real data, sourced from 27 APIs and databases.
Ready to see yours? Head to growthim.com, type in your business, and run your first report.